

Introduction
In the case of modern society, consumption of unhealthy foods such as high calorie, high sugar, and high sodium and excessive sugar and sodium intake are increasing due to food consumption that changes according to various demographic variables, such as simplified food consumption and increased eating out. People’s lifestyle is closely related to food consumption, and now, many health problems of consumers due to changed food consumption are emerging. According to the ‘2008-2018 Community Health Survey’ published by the Korea Centers for Disease Control and Prevention, the obesity rate (self-report) of Korean citizens rose 10.2 percentage points from 21.6% in 2008 to 31.8% in 2018. Obesity, one of the diseases most closely related to eating habits, has been on the rise over the past decade. This increase in obesity rates can lead to social losses. According to a report on the ‘Socioeconomic Impact of Obesity’ published by the National Health Insurance Service in 2018, the socioeconomic cost of obesity in 2016 was 11,467 billion won, up 69% from 2013 (6,769.5 billion won). In order to prevent social loss due to diseases related to the health and eating habits of the people, various regulations or legislation to reduce unhealthy food are coming out in countries around the world including Korea. However, most of these are tax-related policies for taxing unhealthy food. In Korea, it is necessary to increase the acceptability of the system through public understanding and persuasion about the imposition of taxation policy for unhealthy food.
Food consumption is one of the most important factors for a happy and healthy human life. Korea’s household structure is changing from the traditional four or more member of households to one-person households due to rising incomes, increasing women’s socio-economic participation, and improving the quality of education (Jeon and Ahn, 2016). These social developments and changes are closely related to diet behavior. The dietary pattern of modern people has changed from the traditional pattern of making and eating food by themselves to consuming processed foods or increasing the number of eating out, according to the increase in household income, the increase in women’s participation in economic activities, and the increase in opportunity costs for time (Kim and Ahn, 2015). People’s desire for food continues, and at the same time, our dietary life is also bringing about convenient and diverse changes due to various and rapidly developing social changes. Along with these changes in diet, the variety of processed foods with convenience and functionality, such as instant processed foods and freeze-dried foods, are also increasing due to the development of food processing technology and the demands of busy modern people (Park and Ahn, 2014).
In order to reduce the consumption of unhealthy food, an accurate and objective survey on the consumption trends and perceptions of unhealthy food by Koreans should be conducted first. It is necessary to analyze the demographic factors or lifestyles of consumers who mainly consume unhealthy food, and develop policies to reduce the consumption of unhealthy food. Therefore, this study analyzes the propensity and characteristics of consumers who consume unhealthy food through the data of the ‘2019 Processed Food Consumer Attitude Survey’ of the Korea Rural Economic Research Institute and uses the multiple regression analysis method to determine the factors that can affect the consumption of unhealthy food.
Data and Methods
Data
This survey was conducted on a nation-wide of 504 male and female consumers over age 20s. The demographic characteristics of the survey participants are shown in <Table 1>. Among participants, women accounted for 95.24% and men only accounted for 4.76%, this is because the principle food buyers in the household were invited to participate in this survey. The number of household members was 27.18% for single-person households, 30.95% for two-person households, 22.02% for three-person households, 18.06% for four-person households, and 1.79% for five-person households or more. As for the age group, 7.54% in 20’s, 19.05% in 30’s, 24.01% in 40’s, 26.79% in 50’s, 14.88% in 60’s, and 7.74% in 70’s. Regarding marital status, 77.58% were married and 22.42% were single. For the residential area, 48.11% of participants live in the metropolitan area, and 52.89% of participants live in the outside of the metropolitan area. Household income of less than 2 million won was 24.80%, 2 million to 2.99 million won was 15.08%, 3 million to 3.99 million won was 16.67%, 4 million to 4.99 million won 13.10%, and 5 million won or more was 30.36%. There were 11.51% of participants have kids in their household, and 88.49% of participants have no kids in their household. There were 26.79% of patients with disease, and 73.21% without disease. As for the final academic background, 8.33% was under junior high school, 48.02% was under high school, 42.26% was under university graduate, and 1.39% was over university graduate.
Table 1.
Demographic factors of consumers of unhealthy food
Table 2 shows the lifestyle characteristics of the survey targets.
Table 2.
Lifestyle of unhealthy food consumers
Methods
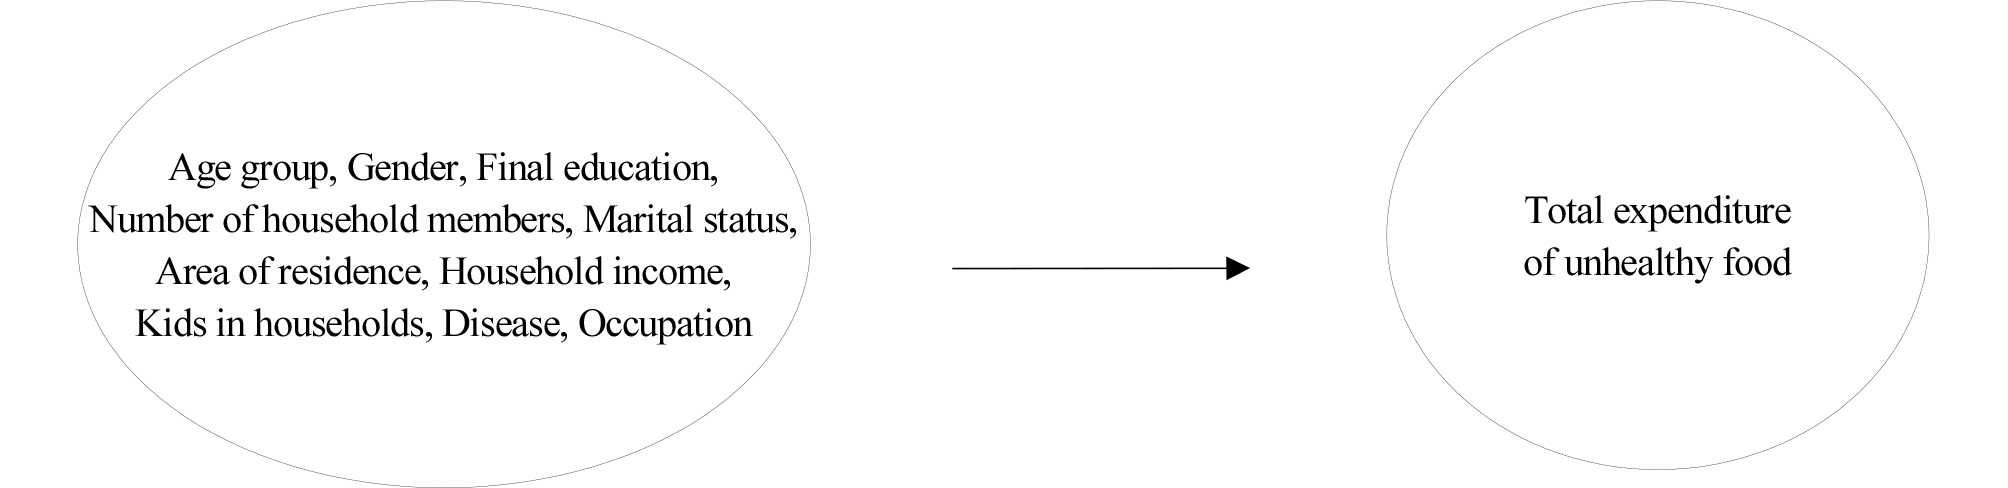
In this study, a multiple regression model was used to analyze the effects of rapidly changing lifestyles and demographic factors on unhealthy food consumption. In order to analyze lifestyle and demographic factors affecting unhealthy food consumption, a total of 10 variables were set as independent variables <Fig. 1>. High salt, high sugar, and high fat products such as sausage, ham, bacon, bread, sweets, candy, chocolate processed products, ramen, carbonated beverages, beer, and soju were classified as unhealthy food, and expenditures on these products were used as dependent variables. The demographic factors used in this analysis are gender, number of household members, age, marital status, residential area, household income, final education, and occupation. For the lifestyle variables, whether convenient meals/delivery and eating out are used, whether various tastes are pursued, and whether processed food expenditures have increased in the past year were reflected in the analysis. The basic model for multiple regression analysis is the same as Equation (1), and is constructed as Equation (2) for the purpose of this study. Stata 12.0 was used as the statistical package.
| $$Y=\beta_0+\beta_1X_1+\beta_2X_2+\beta_3X_3+\bullet\bullet\bullet+\beta_nX_n+e$$ | (1) |
| $$Y=\beta_0+\beta_1SEX+\beta_2FAMILY+\beta_3AGE+\beta_4MARRY+\beta_5LOCATION+\\\beta_6INCOME+\beta_7BABY+\beta_8ILLNESS+\beta_9EDUCATION+\beta_{10}JOB+e$$ | (2) |
Y = Total expenditure on unhealthy food
Regression coefficient
Constant
Error term
Multiple regression analysis is an extension of simple regression analysis by analyzing the correlation between one variable as the dependent variable and other variables as independent variables. Multiple regression analysis is mainly used to predict the dependent variable by deriving a linear regression equation. In particular, multiple regression analysis has the advantage of controlling the influence of several independent variables and identifying the relationship between a specific independent variable and the dependent variable.
Result and Discussion
In order to analyze various factors affecting the consumption of unhealthy food, analysis was conducted by dividing the dependent variable into three categories: total food consumption, unhealthy food consumption, and unhealthy food consumption ratio (total unhealthy food expenditure / total food expenditure). First, when this study analyzing the correlation with the total item expenditure, the number of household members, residential area (excluding Gangwon), the presence of disease, and the trend of processed food consumption for one year showed a significant correlation to the total food expenditure. The results in Table 3 found that who have the higher the number of household members, who have diseases, and who live in the rural area, have lower the proportion of unhealthy food consumption. In addition, compared to a year ago, unhealthy food consumption increased as the consumption of processed food increased.
Table 3.
Factors affecting the total amount of food consumption
According to the results of analysis conducted on the total expenditure of unhealthy food, the result of F verification (Prob> F = 0.000) was found to be significant, indicating that the research model was appropriate, and the explanatory power of the independent variable was 15.67%. The analysis result of unhealthy food expenditure was also found to be valid through F verification (Prob> F = 0.000), and the explanatory power of the independent variable was 17.44%. In addition, in the multicollinearity diagnosis, the VIF statistic was less than 10 for all independent variables, and it was determined that multicollinearity did not occur in the verification of the mutual influence relationship.
As a result of the analysis in Table 4, the largest factor influencing the expenditure of unhealthy food was analyzed by the difference between the metropolitan area and the provinces. In addition, the analysis results show that the number of household members, age group, region, and disease among demographic factors have a significant effect on the expenditure of unhealthy food. It was found to have a significant effect on food expenditure. For each increase in the number of household members, the amount of unhealthy food expenditure increased by 0.6510. This shows that consumption of unhealthy food increased in all households, not just single households. It is also interpreted that the consumption of unhealthy food increased as the number of families increased. In the case of the age group, the expenditure of unhealthy food decreased by -0.4953 as the age increased, which can be seen as the older people consume less unhealthy food. In the case of residential areas, it was found that unhealthy food consumption was significantly affected. Compared to the metropolitan area, unhealthy food consumption was significantly lower in all provinces, and only Gangwon-do was found to be not significant. That means people live in the metropolitan area, they spend more money on unhealthy food consumption. In the case of disease, the unhealthy food expenditure of people without disease was 0.9297 higher. This is interpreted as the fact that people suffering from diseases are making less consumption of unhealthy food for their health. In lifestyle, who have more processed food expenditures compared to a year ago, they have larger the unhealthy food expenditure. It can be seen that a person who spends a lot of processed food also consumes a lot of unhealthy food. On the other hand, gender, marital status, income, kids in households, education, occupation, share of eating out and delivery, and pursuit of various tastes were all analyzed as insignificant to unhealthy food spending.
Table 4.
Factors affecting the total amount of unhealthy food consumption
In the case of the proportion of unhealthy food purchases, age group, marital status, region (excluding Gangwon), and disease status were found to have an effect on demographic factors <Table 5>. In the lifestyle analysis, it was found that the proportion of purchases of unhealthy food was influenced in the case of preferring convenience food, pursuing delivery and eating out, and placing importance on taste <Table 5>. The higher the age group and single group have the lower the proportion of unhealthy food consumption. In addition, compared to the metropolitan area, the consumption of unhealthy food was less in non-metropolitan area, and the proportion of unhealthy food consumption was higher in those without disease.
Table 5.
Factors affecting the expenditure share of unhealthy food consumption
Conclusion
The results of multiple regression analysis in consideration of the demographic factors and lifestyles of consumers who consume unhealthy food show that in the case of demographic factors, the number of household members, age group, residential area, and the presence of diseases have an effect on unhealthy food consumption. In the case of lifestyle, the more processed food expenditure has the greater impact on unhealthy food consumption. On the other hand, factors such as gender, marital status, educational background, increased expenditure of convenience food and delivered food, and various taste pursuits did not affect consumption of unhealthy food. In conclusion, the lower the age and the people lived in the metropolitan area, the more the unhealthy food expenditure showed that the greater proportion of expenditure tend to increase.
In this study, research and analysis were conducted focusing on demographic factors rather than lifestyle. In recent years, people’s lifestyles such as safety-seeking and taste-seeking lifestyles are becoming more subjective and diversified, so the results of this study has limits to present detail explanation for reasons of consuming unhealthy food. Therefore, in another study in the future, analysis of unhealthy food consumers taking into account the consumer’s lifestyle will be required. In addition, the criteria for classifying unhealthy food were not clear, so there were limitations in the analysis. Therefore, in future research, indicators that can classify them are needed, and a more specific and scaled measurement method needs to be developed to approach more objectively.
