

Introduction
Materials and Methods
Samples and DNA preparation
Sequence analysis
Quantitative real-time PCR assay
Results and Discussion
Comparison of chloroplast sequences of C. setidens and S. marianum
Development of chloroplast-based species-specific primers
Performance verification of the developed real-time PCR assays
Analysis of developed assays in commercial food products
서론
Introduction
Medicinal plants have been recognized as highly valuable sources of herbal drugs worldwide (Chen et al., 2016). Because of the beneficial therapeutic properties and low toxicity of medicinal plants, they have been used to treat human diseases for thousands of years (Li et al., 2013). It is generally believed that approximately three-quarters of the world’s population utilizes medicinal plants and their extracts for healing and health care (Jamil et al., 2007). To date, appr oximately 18% of all plant species have been utilized for medicinal purposes (Rajeswara et al., 2012), and the demand for medicinal plants is rapidly increasing. Even though a huge number of medicinal plant species have been processed into functional foods that have been sold worldwide, there have been few studies on the properties of these plants. For example, saffron was used as a medicinal plant between the 16th and 20th centuries, but research into its usage as a functional food has only been conducted recently (Jose et al., 2017).
Cirsium setidens is a wild perennial herb of the Asteraceae family native to Korea with various pharmacological properties including increasing melanin production, antitumor qualities, and antioxidant and hepatoprotective effects (Kim et al., 2016; Lee et al., 2016). Moreover, C. setidens is known as an excellent food for preventing adult diseases because of its antioxidative activity (Lee et al., 2006). Therefore, C. setidens is widely sold in the form of dried food for its health benefits in Korea. Similarly, Silybum marianum is a plant of the Asteraceae family cultivated worldwide with excellent pharmacological effects related to kidney, spleen, liver, and gallbladder diseases (Abenaboli et al., 2018). Specially, silymarin is a major component of S. marianum and is a combination of flavonoids known for its hepatoprotective effects (Bahmani et al., 2015). S. marianum is mainly sold in the form of pills or tablets, and between 8 and 33% of the world’s liver disease patients have consumed this plant because of its medicinal effects (Khan et al., 2014). However, despite many advantages, the functional food market has been plagued with food fraud and adulteration, often by way of deliberate mislabeling and adding low-cost materials during food processing. Because the processed plant materials are morphologically very similar to each other, it is difficult to distinguish between reliable and counterfeit raw materials (Kim et al., 2017). The misuse of these two medical plants may cause a range of adverse side effects due to their differing pharmacological effects, and more work still remains to be achieved. Therefore, there is a need to develop techniques to protect consumers from food adulteration and fraud in the form of deliberate mislabeling or low-cost material addition.
Chloroplasts are plant cell organelles responsible for photosynthesis with hundreds of copies per cell. Chloroplast genomes are surrounded by two membrane layers, which protect against degradation during food processing (Garino et al., 2016). Thus, chloroplast genomes have been widely used to develop specific barcode markers for plant species identification as well as to conduct phylogenetic and evolutionary studies (Provan et al., 2016). In particular, the NADH oxidoreductase (ndhA, and ndhF) and Rubisco large-subunit genes (rbcL) of chloroplasts have proven to be suitable for developing specific barcode markers in the Asteraceae family (Curci et al., 2015). In addition, the ycf1 region has frequently been used for DNA barcode-based species identification because of its high variability among species (Dong et al., 2015).
Compared to chemical analysis, polymerase chain reaction (PCR) has been widely used for species classification because of its economic and timesaving advantages. Particularly, quantitative real-time PCR (qPCR) assays are highly accurate and sensitive and can detect very low levels of target species DNA in commercial foods. As such, this technique has been used in many studies that have focused on detecting ingredients such as Cynanchum wilfordii (Kim et al., 2017), Orostachys japonica (An et al., 2018), saffron (Villa et al., 2017), and nuts (Kim et al., 2018).
Recently, molecular markers have been developed to distinguish Korea-specific thistle species such as Cirsium japonicum, C. nipponicum, and C. arvense from S. marianum by using single nucleotide polymorphisms (SNPs) of internal transcribed spacer (ITS) (Lee et al., 2018). However, there have been no reported markers for distinguishing between C. setidens and S. marianum, even though there is a possibility of misuse between these plants in Korean commercial foods products. Therefore, because of the increasing consumption of both plants in Korea, it is necessary to develop markers to distinguish between these species in commercial food products to prevent the misuse of both plants. In this study, we developed six species-specific primer pairs from four chloroplast genes using SNPs of C. setidens and S. marianum, used SYBR Green-based qPCR to evaluate the performance of the developed markers, and applied the markers to thirteen commercial products to confirm practicality.
Materials and Methods
Samples and DNA preparation
C. setidens seeds (NIBRVP0000353367) were provided from National Institute of Biological Resources (NIBR, Incheon, Korea). S. marianum seeds were purchased from a commercial company (Aramseed, Seoul, Korea). Both plants were grown in a well-controlled greenhouse and were sampled for genomic DNA extraction after six weeks. A total of 12 commercial food products were used in this study, and all were purchased from local markets (Table 1).
Table 1. Commercial food products used in this study
Genomic DNA was extracted from fresh plant leaves and commercial foods using the i-genomic Plant DNA Extraction Mini Kit (iNtRON Biotechnology, Seongnam, Korea) in accordance with the manufacturer’s protocol. The concentration and purity of the extracted genomic DNA was measured using a SPECTROstar Nano microplate reader (BMG Labtech, Ortenberg, Germany).
Sequence analysis
Nucleotide sequences of four genes (ndhA, ndhF, rbcL and ycf1) of S. marianum chloroplast genome (Accession no. NC_028027) were downloaded from the National Center for Biotechnology Information (NCBI; https://www. ncbi.nlm.nih.gov/). However, due to a lack of information of the nucleotide sequences of the four chloroplast genes of C. setidens in the database, conventional primers were designed using Beacon DesignerTM (PRIMER Biosoft, Palo Alto, CA, USA) on the basis of the nucleotide sequences of S. marianum, and then used to amplify the PCR products with the obtained gene fragments. Sequences of the designed primer pairs are listed in Table 2. A conventional PCR was performed in a final volume of 25 µL using the TaKaRa PCR Thermal Cycler Dice (TaKaRa Bio Company, Shiga, Japan). The reaction mixture contained 10 ng of genomic DNA, 10X Ex Taq buffer, 2.5 mM dNTPs, 10 pmol of each primer, 0.5 U/µL EX Taq DNA polymerase (Takara) and was adjusted to a final volume of 25 µL with free water. The amplification conditions were set as initial denaturation step at 95°C for 5 min, followed by 35 repetitions of the following cycle: denaturation step, 95°C, 10 s; annealing step, appropriate annealing temperature for each primer (Table 2), 30 s; and elongation step, 72°C, 1 min. The final step took place at 72°C for 5 min. The amplified products were analyzed on a 1.5% agarose gel and were extracted using the DOKDO PrepTM Gel Extraction Kit (ELPIS-Biotech. Inc., Korea) in accordance with the manufacturer’s protocol. To get clear nucleotide sequences of both the plants, PCR products were cloned using a RBC T&A Cloning Vector (Real Biotech Corporation, Taipei, Taiwan) and TaKaRa ligation mix. Cloned plasmid DNA was purified using the DOKDO PrepTM Plasmid Mini-Prep Kit (ELPIS-Biotech, Daejeon, Korea), and sequence analysis was carried out by a commercial service (Macrogen, Seoul, Korea). The sequences were aligned using ClustalW2 (ftp://ebi.ac.uk/ pub/software/clustalw2/) and BioEdit 7.2 software packages (Ibis Biosciences, Carlsbad, CA, USA).
Table 2. Information on the developed conventional PCR primer pairs used in this study
Quantitative real-time PCR assay
All developed primer pairs were designed using Beacon DesignerTM (Palo Alto) and were synthesized by a commercial service (Macrogen). Real-time PCR assays were performed in a final volume of 20 µL using the AccuPower® 2X GreenStarTM qPCR Master Mix (Bioneer, Daejeon, Korea) through the QuantStudio 3 real-time PCR System (Applied Biosystems, Foster City, CA, USA). All the reaction mixtures contained 10 µL 2X GreenStar Master Mix; 0.5 µL 10 pmol each primer set; 1 µL of 10 ng genomic DNA; 0.25 µL ROX Dye; and 7.75 µL PCR-grade water. The real-time PCR conditions were as follows: pre-denaturation step, 95°C, 10 min; denaturation step, 95°C, 15 s; annealing step, Tm of primers (55-57°C), 30 s; extension step, 72°C, 30 s; and melting curve stage 1 step.
To evaluate the performances of developed primers, standard curves were obtained using ten-fold serially diluted DNA samples from each plant at concentrations of 0.001 to 10 ng. Correlation coefficients (R2) were determined using liner regression (R2 ≥ 0.98) (Ramakers et al., 2003). Amplification efficiency was calculated on the basis of the standard curve using the following equations: E = 10-1/slope and efficiency (%) = (E– 1) X 100. In terms of the performance of the primers, slopes were between -3.1 and -3.6; efficiencies ranged from 90% to 110%; correlation coefficients (R2) were all above 0.98, and the limits of detection (LOD) were determined to the lowest concentration at which 95% of the positive samples are detected according to the guidelines in “Minimum Information for Publication of Quantitative real-Time PCR Experiments” (Bustin et al., 2009) and “Definition of minimum performance requirements for analytical methods of GMO testing” (ENGL, 2016).
To verify the reproducibility and accuracy of the developed real-time PCR method, we performed inter- laboratory validations in two different laboratories. These inter-laboratory validations were performed under the same PCR conditions, using the ABI 7500 Fast real-time PCR system (Applied Biosystems, Foster City, CA, USA) in one laboratory and the CFX connect real-time PCR System (Bio-Rad, California, USA) in the other.
To evaluate the specificity of the developed primer pairs, we used binary mixtures of C. setidens and S. marianum DNA. The binary mixtures were prepared from ten-fold serially diluted (10-0.01%) mixed DNA samples and were applied to the real-time PCR assay.
Results and Discussion
Comparison of chloroplast sequences of C. setidens and S. marianum
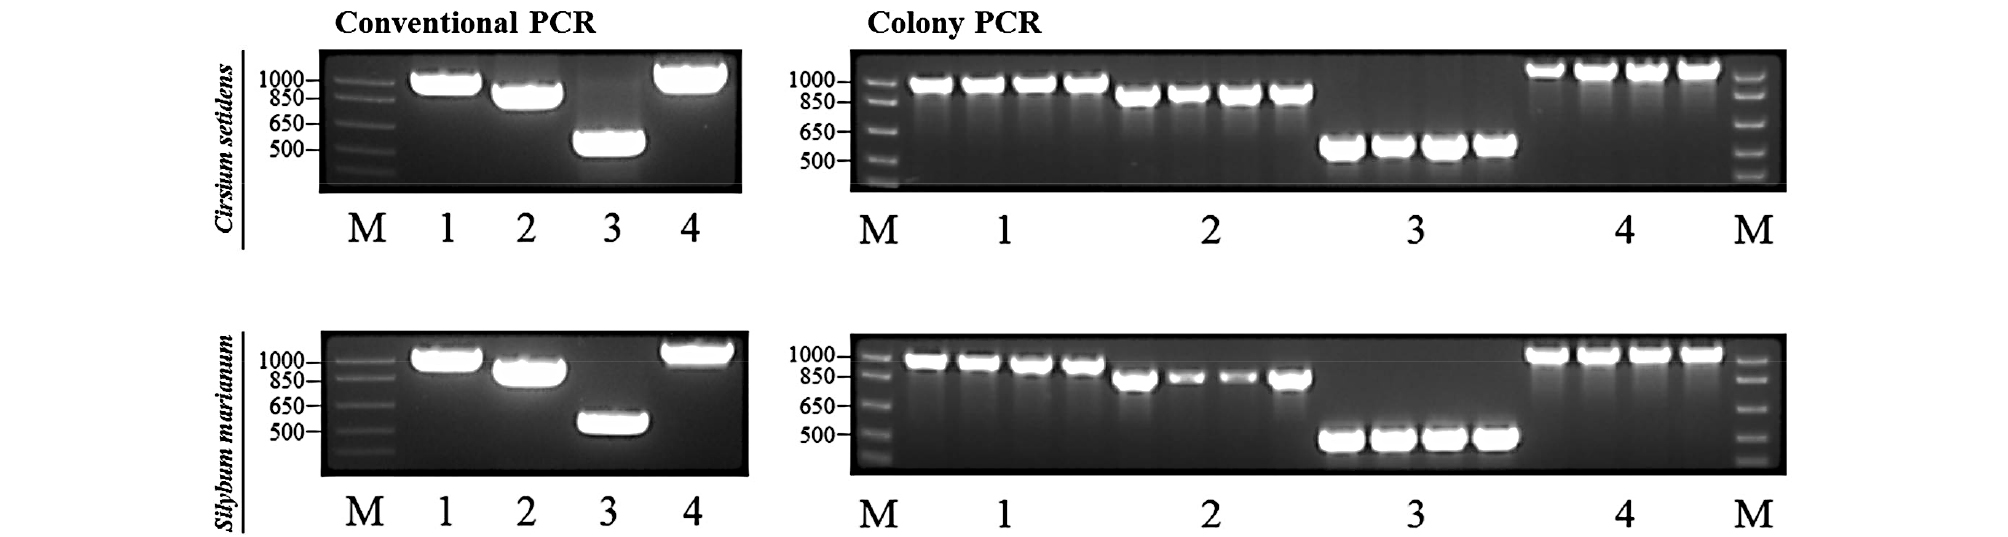
We analyzed four chloroplast sequences (ndhA, ndhF, rbcL, and ycf1) of C. setidens and S. marianum in order to design species-specific primer pairs. As of October 2018, the chloroplast genome sequences of S. marianum have been available in the NCBI public sequence database, whereas those of C. setidens had not yet been reported. To identify the four chloroplast sequences of C. setidens and S. marianum, we designed conventional PCR primer pairs ranging from 530 to 1047 bp to amplify the genes based on the gene sequences of S. marianum (Table 2). As a result, each of the four PCR amplicons was successfully amplified in both plants, and they were then cloned to obtain the four chloroplast sequences (Fig. 1). The sequences of both plants were analyzed using ClustalW2 and BioEdit 7.2 software packages.
Development of chloroplast-based species-specific primers
The species-specific primers were designed using a commercial program (Beacon DesignerTM) on the basis of SNPs of the chloroplast genes of C. setidens and S. marianum (Fig. 2). Since the DNA of processed foods tended to be degraded into short fragments during food processing steps, such as heating and high-pressure treatment, small PCR products are advantageous compared to large PCR products (Lo et al., 2018). Therefore, we developed three pairs of each species-specific primer, which could amplify short PCR amplicons of 87-202 bp, to detect target species in processed foods (Table 3). However, species-specific primer pairs in S. marianum ndhF gene did not work well due to the fact that only one SNP might be present in the forward or reverse primer (Fig. 3), although the other primer pairs with one SNP were working well. It has been reported that adding mismatches to the bases around the SNP could resolve this issue via increasing the primer specificity (Allmann et al., 1993; Hayashi 2004). Also, our previous study has shown that adding mismatches to nearby 5’ ends of forward and reverse primers could increase the primer specificity (An et al., 2018). Therefore, we added mismatches to the bases of the S. marianum ndhF primer pairs to increase specificity. Consequently, the mismatched S. marianum ndhF primer pairs showed improved specificity compared to that of the original S. marianum ndhF primer pairs (Fig. 3).
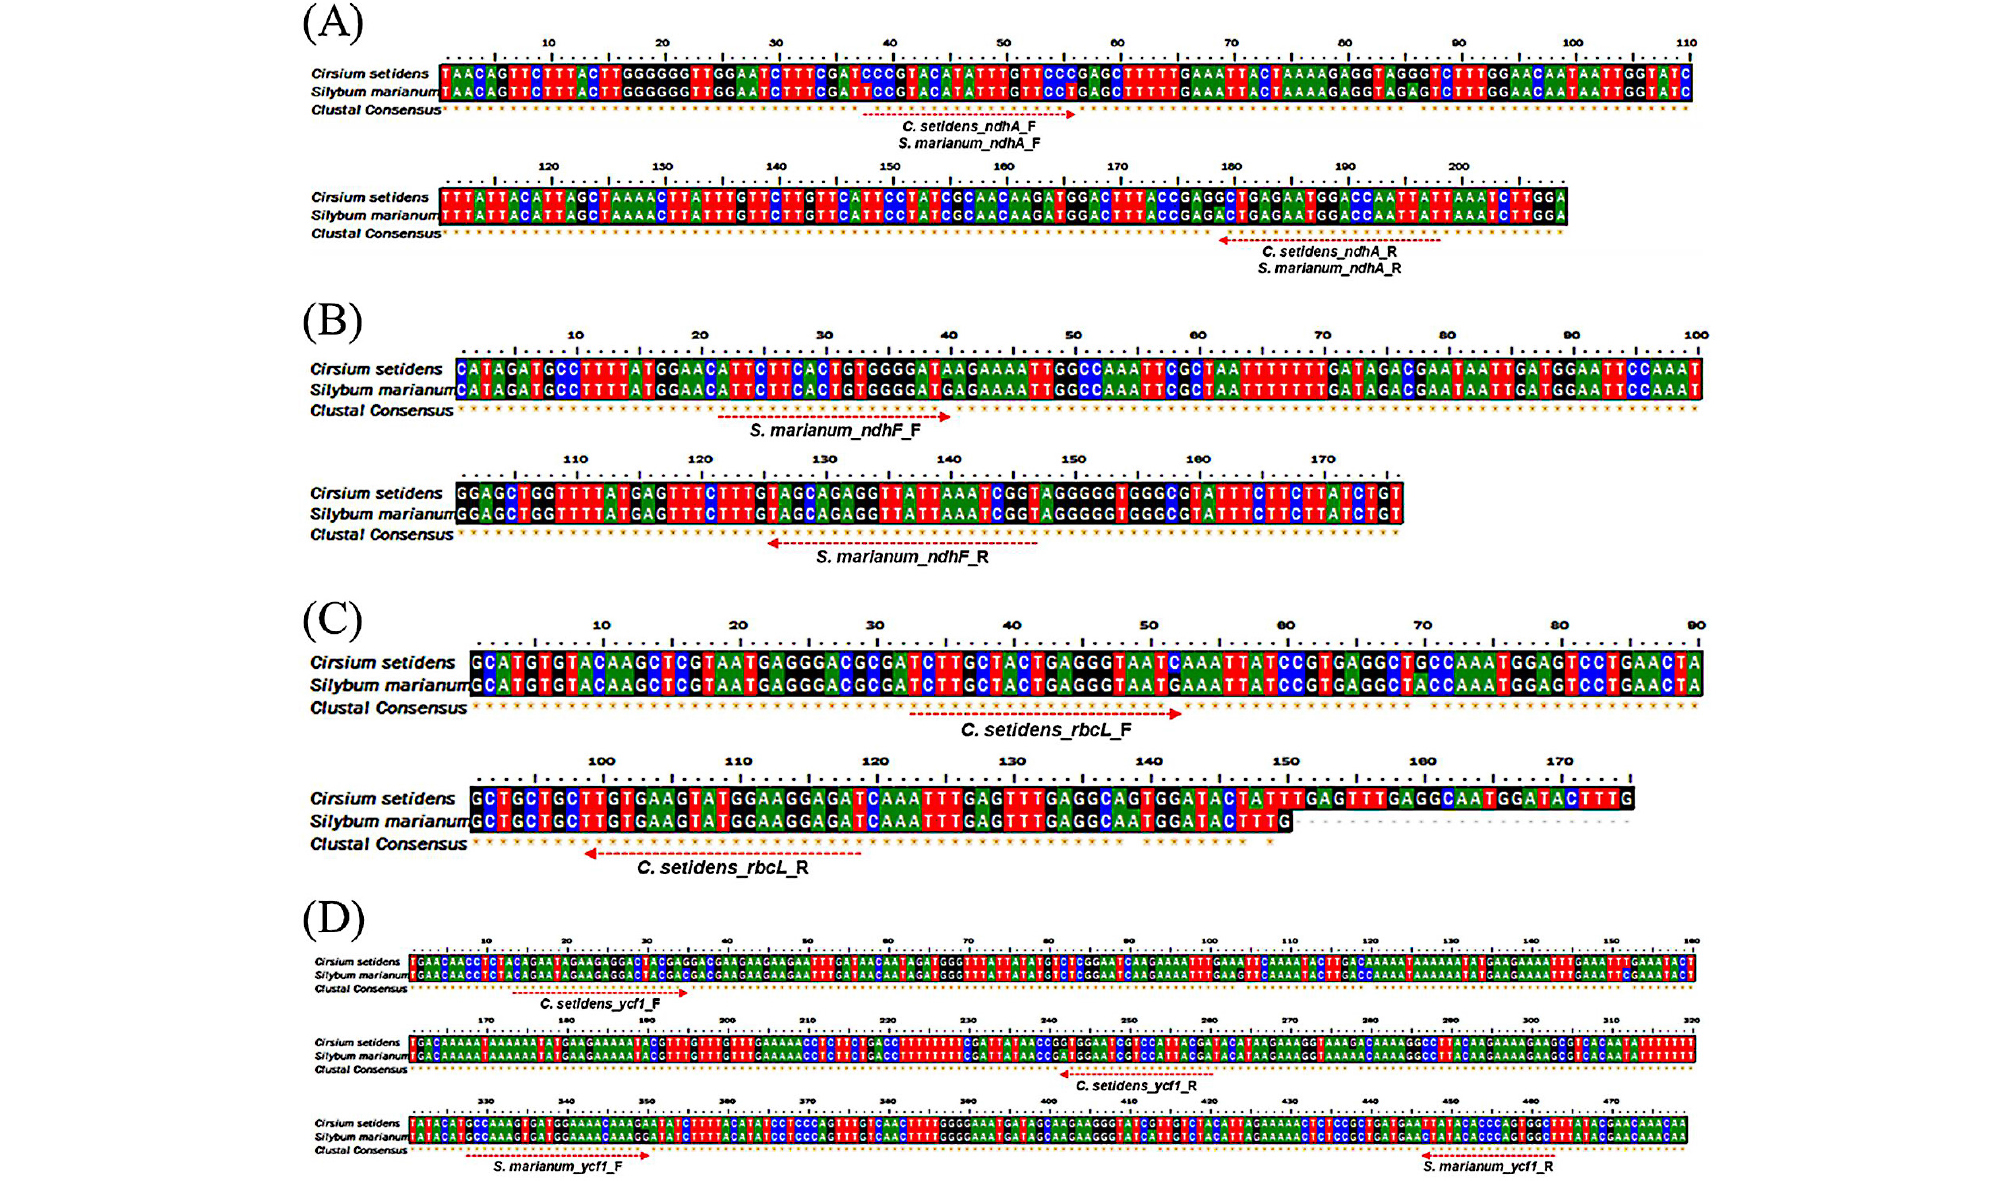
Table 3. Information on the developed species-specific primer pairs used in this study
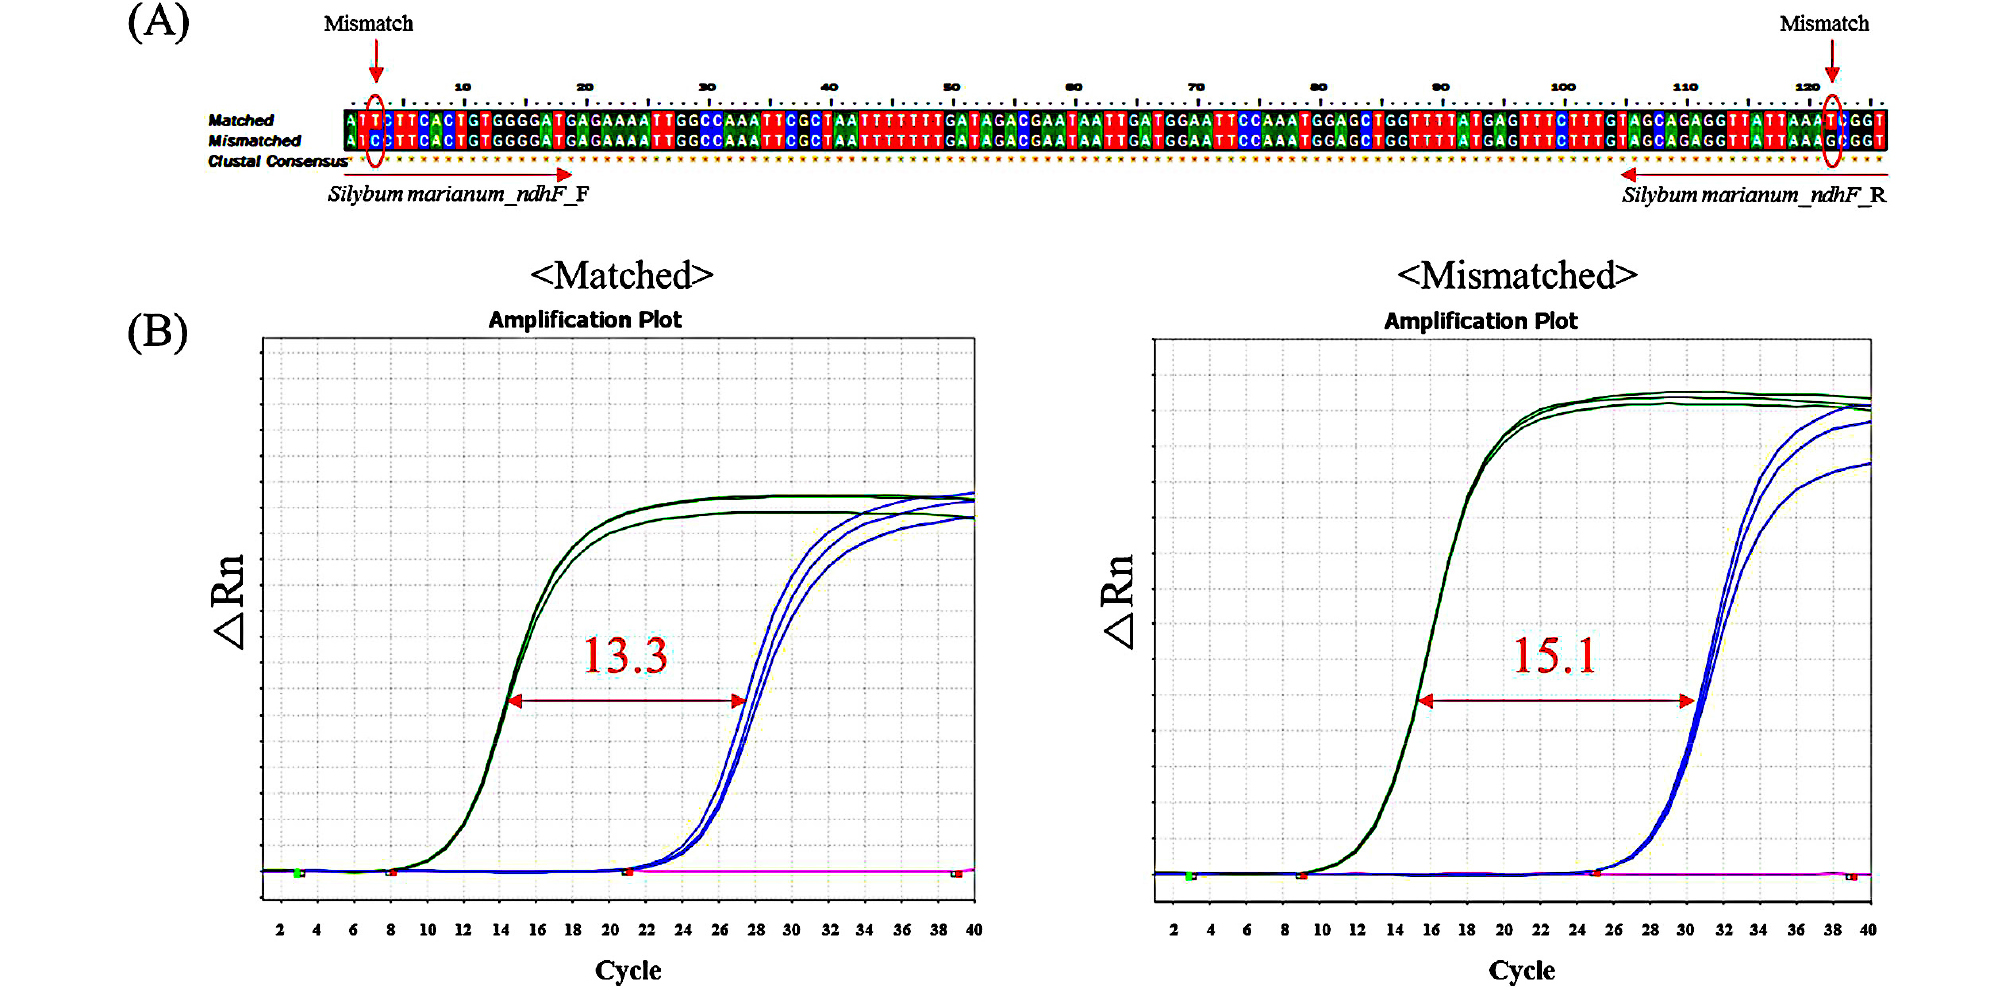
Fig. 3.
(A) Mismatched sequences of Silybum marianum ndhF primer pairs. (B) Comparison of amplification CT values for S. marianum and Cirsium setidens before and after adding mismatches to S. marianum ndhF primer pairs (Green for S. marianum; Blue for C. setidens; Pink for NTC). All DNA samples were quantitated at 10 ng before use in the experiments.
Performance verification of the developed real-time PCR assays
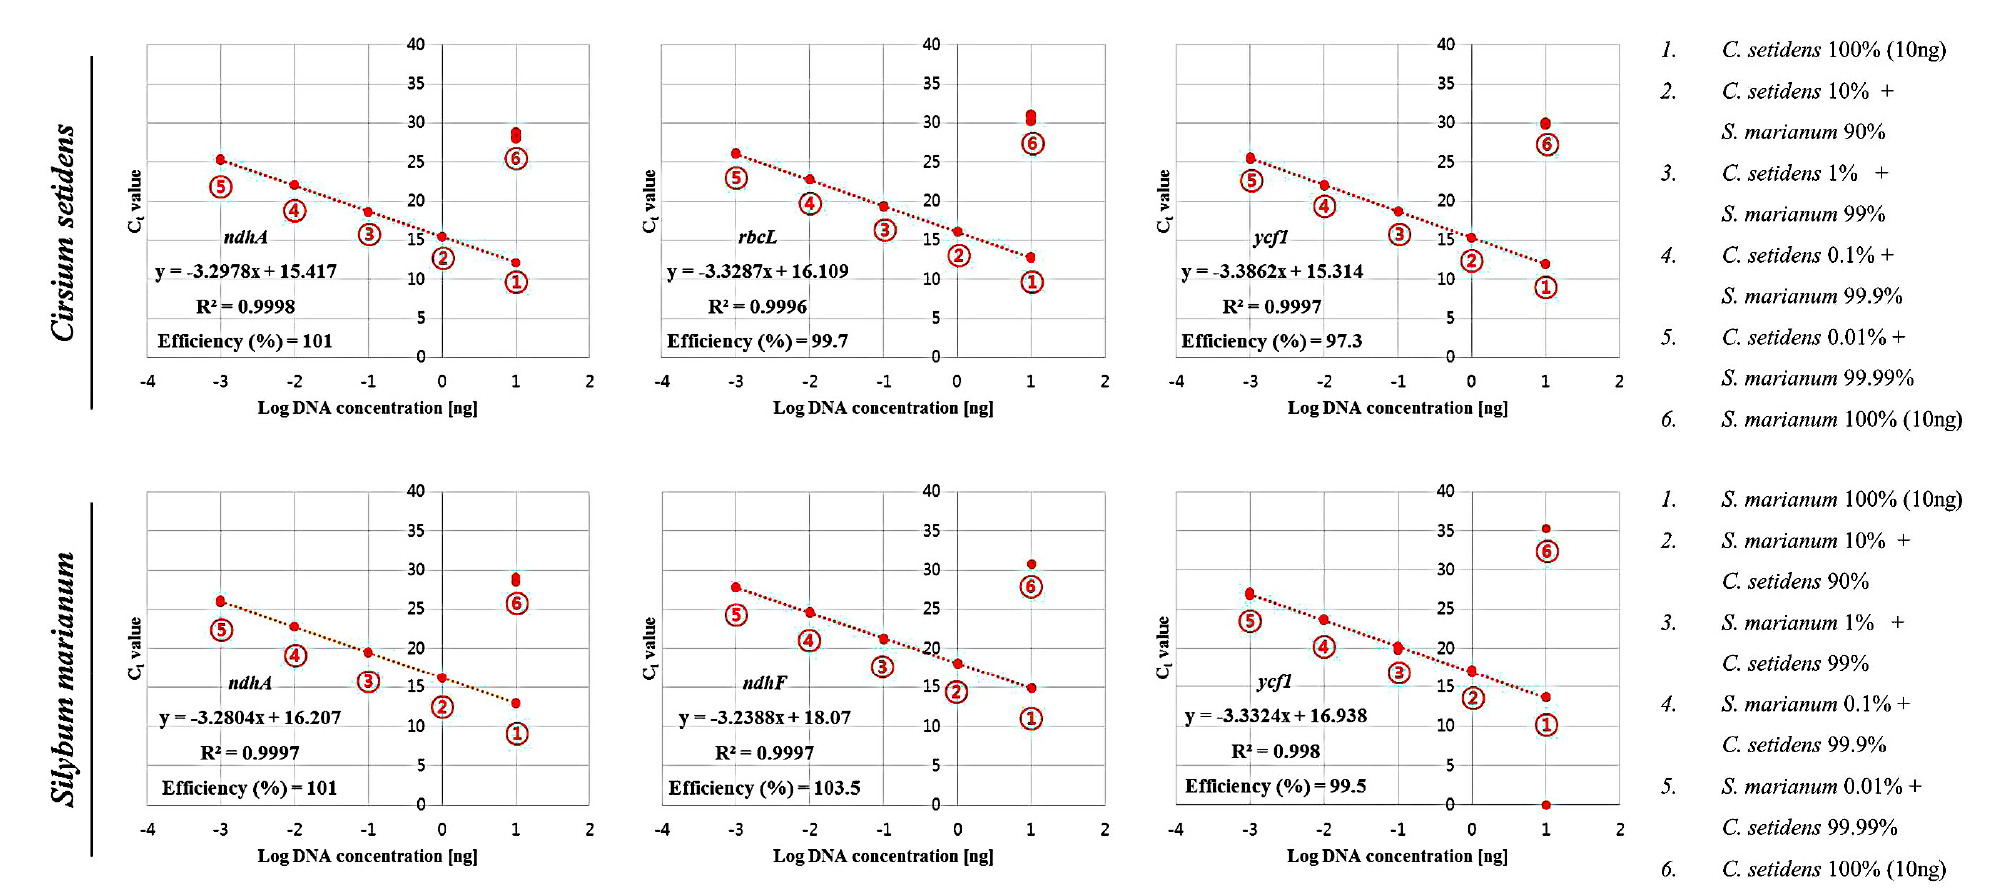
To verify the efficiency and sensitivity of the developed species-specific primer pairs, we performed real-time PCR assays using ten-fold serially diluted DNA (10 ng to 1 pg) from each species. Before verifying primer performance, the quality of the extracted genomic DNA was first confirmed by qPCR assays using universal plant primer pairs (Hirotsu et al., 2010), (Table 4). Then, the performance of the developed primer pairs was examined. As a result, all developed species-specific primer pairs had strong correlation coefficients (R2 > 0.99), and their efficiencies and slopes were in the ranges of 93-103% and -3.23 to -3.49, respectively, for their target species (Fig. 4, Table 4). However, no significance was found for the correlation coefficient with non-target species (Fig. 4).
Table 4. Slopes, correlation coefficients, efficiencies, and Ct values obtained by qPCR assays using the developed primers
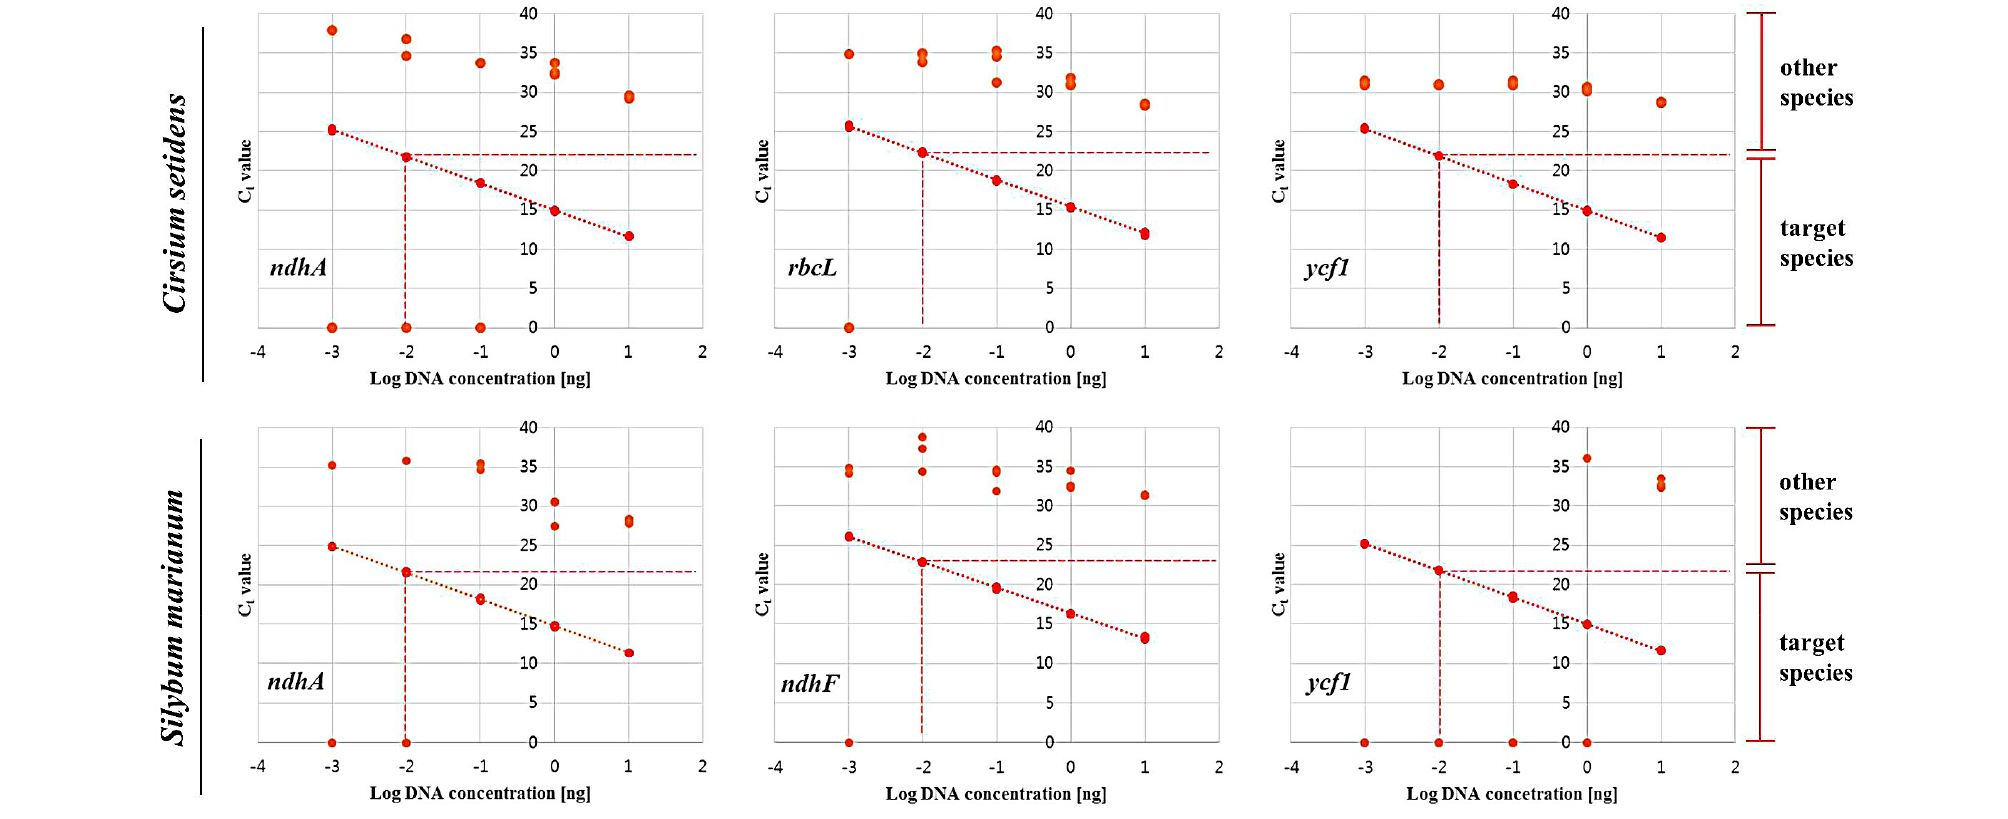
Fig. 4.
Standard curves obtained by applying ten-fold serial diluted DNA (10 ng-1 pg) of Cirsium setidens and Silybum marianum to each species-specific primer pair. All standard curves were constructed based on efficiency and correlation coefficient (R2). The x-axis and y-axis represent log DNA concentration and Ct value, respectively.
In general, analyses developed in a single laboratory are less reliable than those tested through inter-laboratory validation. Therefore, we verified the performances of the developed species-specific primer pairs in two other laboratories. As a result, all of the developed species-specific primer pairs showed strong correlation coefficients (R2 > 0.99), and their efficiencies and slopes were in the ranges of 90-100% and -3.33 to -3.58, respectively, in both laboratories (Table 5). Therefore, we conclude that the developed real-time PCR assays are acceptable for detecting the target species in commercial foods.
Table 5. Results of inter-laboratory validation using the developed real-time PCR assays
In order to verify the specificity of the developed species-specific primer pairs, we performed real-time PCR using serially diluted binary mixtures of C. setidens and S. marianum DNA. As a result, all developed primers were found to be highly specific to their target species. For example, all developed primer pairs could discriminate 0.01% target DNA within non-target DNA (99.99%) (Fig. 5). For this reason, we conclude that the developed real-time PCR assays can clearly detect as little as 0.01% target DNA (1 pg) within the mixtures.
Analysis of developed assays in commercial food products
In order to verify the ability of the developed real-time PCR systems to detect each species in C. setidens and S. marianum commercial products, a total of 12 commercial food products were purchased from local markets and tested (listed in Table 1). Prior to applying the commercial foods to the developed assays, plant universal primers were used to test whether the 10 ng genomic DNA extracted from each food product was suitable for the PCR amplification. As a result, all commercial products apart from one S. marianum extract tablet, contained DNA suitable for PCR amplification. Because the one unsuitable tablet product mentioned above (sample 12) was produced using 70% ethanol extracts, little plant DNA may be present in the product, resulting in it not being suitable for PCR amplification (high Ct values of more than 20 in plant universal primers).
Subsequently, the Ct values of the 12 commercial products were determined based on the developed real-time PCR assays (Table 6). Seven C. setidens commercial products were amplified with low Ct values (11.97-16.87) below the LODs (Ct values of 10 pg) of the C. setidens target primer pairs, and high Ct values (27.34-NA) above the LODs (Ct values of 10 pg) of the S. marianum target primer pairs. Therefore, the tested C. setidens products included C. setidens DNA but not S. marianum DNA. Subsequently, five S. marianum commercial products were examined by the developed primer pairs. Four of five commercial products (two powder and two pill products) were amplified with low Ct values (14.82-16.17) below the LODs of S. marianum target primer pairs and high Ct values (24.5-32.4) above the LODs of C. setidens target primer pairs. However, one S. marianum tablet product was amplified with high Ct values above the LODs of C. setidens target primer pairs and S. marianum target primer pairs, suggesting that neither of the two species were detected due to low plant DNA contents. Consequentially, the presence of C. setidens was determined in all of seven C. setidens commercial products, while presence of S. marianum was confirmed in four of five S. marianum products. In the case of the ethanol extracted tablet product of S. marianum, we could not determine the presence of any plant DNA, suggesting that another analytic method should be developed for evaluating this type of food product. Both C. setidens and S. marianum commercial foods have been recently gaining in popularity in Korea and worldwide due to the health benefits that they provide (Lee et al., 2006; Abenavoli et al., 2018). The effects of each plant on human health are quite different. Therefore, authentication of the plant species present in commercial food products is important for ensuring food safety and consumer protection.
Table 6. Amplified Ct values of 12 commercial food products by qPCR using the developed primer sets
Compared to other chemical assays, the developed SYBR Green-based qPCR assay is known to be faster, more stable, and less expensive and is a useful method for the detection and quantification of target nucleotides (Ponchel et al., 2003). Recently, many studies have been conducted for detecting plant species in processed foods using SYBR Green-based techniques: hazelnut (Arlorio et al., 2007), almond (Pafundo et al., 2009), O. japonica (An et al., 2018), and C. wilfordii and C. auriculatum (Kim et al., 2017). In this study, we developed species-specific primer sets using four chloroplast genes to distinguish both C. setidens and S. marianum, tested their performance, specificity, and sensitivity, and then applied the primers to commercial products. The developed species-specific primer sets are able to detect the presence of C. setidens and S. marianum in commercial products, suggesting that the method developed could be useful in verifying the authenticity of commercial food products.
