

Introduction
Situation of Vietnamese fruit industry
Comparative advantages
Analysis of Factors affect to Vietnamese fruits export
PRICES (EXPRICEVN and EXPRICEOTHER)
GDPC
DUMMY
DIST
EXRATIO
AREAP
IMOTHER
Conclusion and implication
Introduction
International trade is one of the existing fields to explain the whole aspects of economic affairs in the world (Krugman al., 2018). Joining the international trade is the best way to gain a greater return for both home country and foreign country because of their resource endowment and human capacity (Knutson and Penn, 2007).
The global exchange of fruits and vegetables was increased because of the reducing of tariff barriers through efforts to growing regional trade agreements, negotiation for free trade agreements. Trading global between North-South is increasing due to the counter-cyclical seasons. Because of the seasonal character, disadvantages in natural conditions... domestic production faced with production shortages and high price. This drives down consumer demand for the domestic products to be replaced by imported things (Buzby, 2001).
A diet high in fruits was proved that it has various benefits for the human body such as reducing the death which has causes related to lacking nutrition supplied by consumed fruits and helpful to weight management (Grimm, 2010). Income increase is leading changes in consumption behavior of consumers; they consume more fruits than they did in the past. In developed countries, consumers have more demand for higher quality vegetables and more variation in the daily menu. In developing countries, the changes were starting from the educated generation and middle class with increasing incomes (Dias, 2010).
In Vietnam, after "Renovation-Doimoi" in 1986, the economic integration is one of the most important strategies of the Vietnamese Government which was implemented through international trade activities. As one of the most active countries in the world doing negotiate and sign Free Trade Agreement (FTA), member of World Trade Organization (WTO) and Association of South East Asian Nations (ASEAN), Vietnam has exported goods to 200 countries (General Department of Vietnam Customs, 2017).
With advantages in terms of terrain conditions, diverse climates and long traditional agricultural production, Vietnam has plenty of opportunities in producing fruits of various types and good quality. The export value of Vietnamese fruits has always tended to increase strongly over the years. In 2017, the export of this sector was estimated at over 3.5 billion USD, increasing 42.5% over the same period of 2016 (Vietnam Fruit & Vegetables Association, 2018). These figures are higher than those of rice, which is the main major export item of Vietnam for many years.
From 2011 up to now, the market value of fruit and vegetable imports in the world exceeded 200 billion USD a year while Vietnam's fruit and vegetable exports account for less than 2% of Global consumption (ITC, 2017). It noted that during five years’ period (from 2012 to 2016) the export value of fruits usually accounts for about 70 percent of the total value export of fruit and vegetable of Vietnam (ITC, 2017). This suggests that the potential for Vietnamese export fruits could be large, which was defined by the Vietnamese Government.
In 2017, the study of Viet Van Hoang and his colleagues showed that Vietnam has strong comparative advantages in crop sectors including fruits at 2 and 3 digits (Viet al., 2017). In 2010, Gravity model was applied in research of Binh Dinh Thi Thanh to find out the main factors affected to value export agricultural products export (Binh al., 2011). However, there is no detailed study for Vietnamese fruits export including export capability and factors affected.
Therefore, the objectives of this study are to find out potential export capability and what main factors are affected on exporting Vietnamese fruits, which will be done by calculating Revealed Comparative Advantage (RCA) index and adapting Gravity model such as export equation.
The range of the study used data period till 2016 of Vietnam and Vietnamese’s top trading partners. It used data for fruit at 2 digits and 4 digits levels from ITC and United National Conference on Trade and Development (UNCTAD) (ITC, 2017; UNCTADSTAT 2017).
Situation of Vietnamese fruit industry
Vietnam is on the eastern Indochina Peninsula between the latitudes 8° and 24°N, and the longitudes 102° and 110°E. The total area of Vietnam is about 331,210 km2. The combined length of the country's land boundaries is 4,639 km and its coastline is 3,444 km long. Base on the special characteristics of geographical conditions with the long shape, Vietnam has a wide range of climate which differs from place to place, particularly between the north and the south parts. Therefore, diverse horticultural, particularly fruits for both temperate and tropical crops are produced in Vietnam.
According to the changing of agriculture development and Government’s policies before and after “Doimoi” fruit production sector also has changed by time changing (Fig. 1).
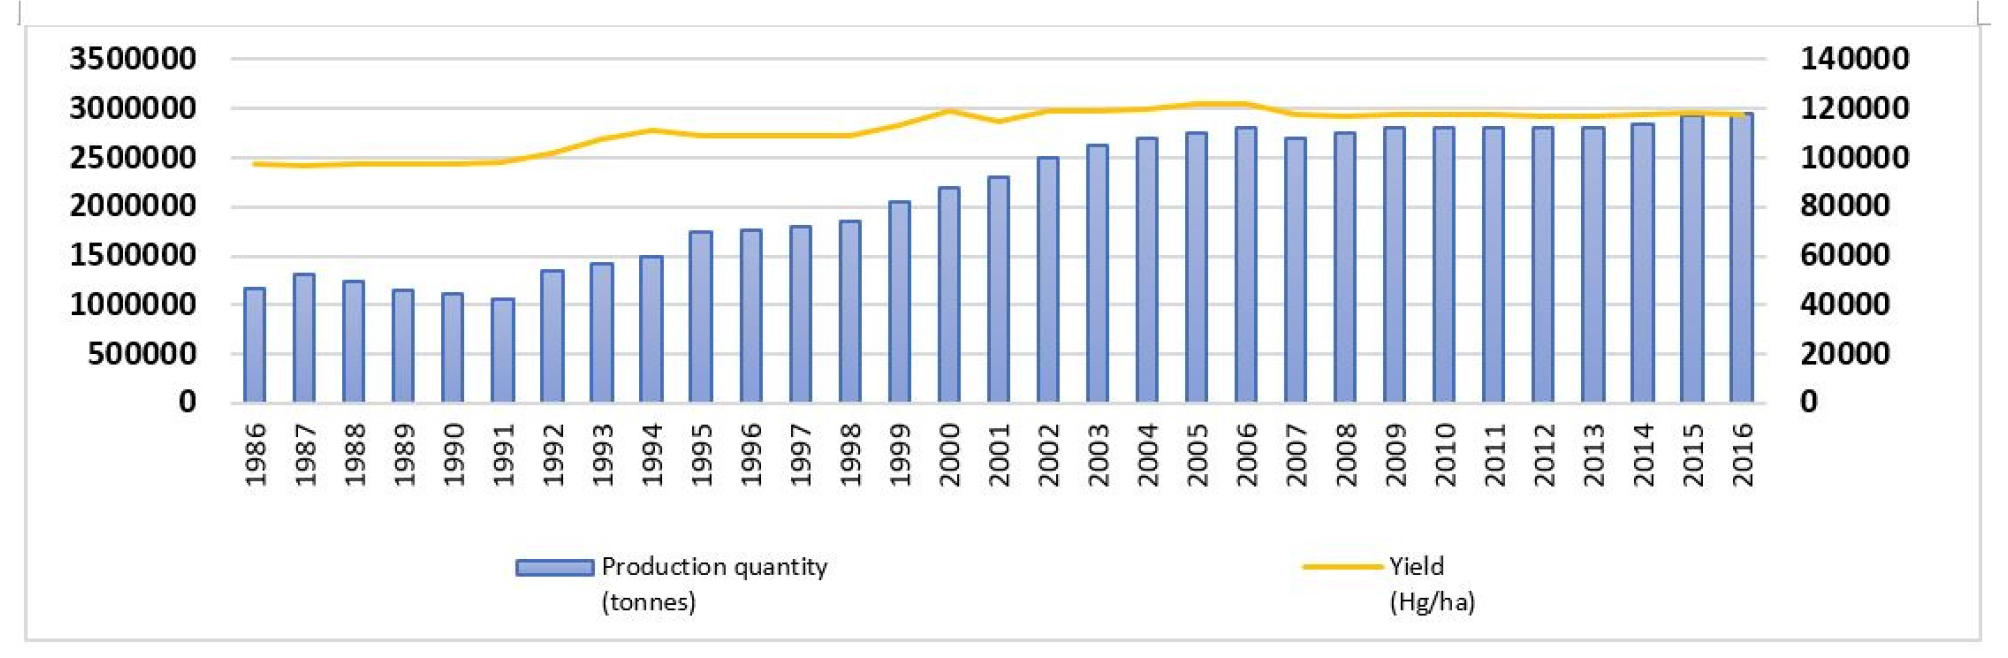
The Vietnamese Government has supported the private sector so they can engage their own business in the fruit and vegetable sector by several advantage policies. As a result, the production quantity of fruits in Vietnam was increasing gradually from 2010 to 2016.
Comparative advantages
Absolute advantage concept was discovered by Adam Smith and developed by several research scientists. In 1817, the theory of comparative advantage was completed by David Ricardo. This theory was explained that because of differences in labour productivity between two countries, both of them can engage in international trade while one country’s workers are less efficient at producing every good than workers in another country. These two countries if having the capacity to produce two commodities and entry in the free market, each country will enlarge total consumption by exporting the good which has comparative advantages while importing another good.
Balassa, in 1965 contributed to apply comparative advantage theory as an efficient tool to measure and define trading commodities among countries through revealed comparative advantage (RCA) index. It shows the normalized export shares with respect to the export of the same product or group of the products belonged to the reference countries (Balassa, 1965).
Applying the theory about comparative advantage, the RCA index will be calculated for Vietnamese fruits export to check about the capabilities of Vietnam in exporting fruits following the equation (1).
| $$RCA=\frac{(Xvi/Xva)}{(Xwi/Xwa)}$$ | (1) |
where:
Xvi: Export value of product i from Vietnam;
Xva: Total Agricultural export value of Vietnam;
Xwi: Export value of product i in the world;
Xwa: Total Agricultural export value in the world.
The value of RCA is between 0 and +∞, and the comparative-advantage-neutral point is 1. The higher value of RCA index shows the stronger the specialization of the country in producing the product. The RCA index is classified into four groups: (i) 0 < RCA ≤ 1 those are the countries without a comparative advantage; (ii) 1 < RCA ≤ 2 the countries achieve a “weak” comparative advantages; (iii) 2 < RCA ≤ 4 relates a “medium” comparative advantage; and (iv) 4 < RCA indicates a “strong” comparative advantage to rank the revealed comparative advantages among countries (Hinloopen and Van, 2001).
Comparing RCA index between Vietnam and their top trading partners indicates that Vietnam’s RCA index is the highest among the ten countries (Table 1). This confirms the capability of Vietnam in exporting fruits and explaining the reason for the cooperation between Vietnam and our top trading partners.
Table 1.
The average RCA indexes for the Vietnamese fruit sector and top trading partners - HS 02 digits (08)
Source: UNCTADSTAT(2017)
Detailed calculating RCA for 14 groups of fruits (Table 2) illustrates that Vietnam has an extremely comparative advantage (average RCA is equal 19.69) in group 0801- Coconuts, Brazil nuts and cashew nuts, fresh or dried, whether or not shelled or peeled.
Table 2.
The RCA indexes for specific Vietnamese fruit groups - HS 04 digits
Source: UNCTADSTAT(2017)
From 2012 to 2016, Vietnam is the first country in the world in exporting fruits which the portion of 0801 group is more than 30 percent market share in the world (ITC, 2017).
The results from the calculated the RCA index represent to potential capability export of Vietnamese fruits. In general, Vietnam has a comparative advantage in exporting fruits in the world market. Specifically, value export for coconuts, Brazil nuts and cashew nuts of Vietnam is about 2.7 times bigger than India which is the second biggest export country for the type of products (ITC, 2017). This can be considered as one of the unique advantages of Vietnam in export fruits.
Analysis of Factors affect to Vietnamese fruits export
Gravity model predicts the volume of trade between two countries according the following equation [17]:
| $$T_{ij}=A\times Y_i\times Y_j\times\frac1{D_{ij}}$$ | (2) |
where:
A: A constant term,
Tij: The value of trade between country i and country j,
Yi: Country i’s Gross Domestic Product (GDP),
Yj: Country j’s GDP,
Dij: The distance between the two countries i and j.
The traditional approach to estimation this equation consists in taking logs of both sides, following log-log model:
| $$\mathrm{In}T_{ij}=\beta_0+\beta_1\mathrm{In}Y_i+\beta_2\mathrm{In}Y_j-\beta_3\mathrm{In}D_{ij}+\epsilon_{ij}$$ | (3) |
However, in applied works, the model is usually extended by enlarging the number of variables such as tariffs, language relationships, exchange rate, colonial history, etc (Shepherd, 2013).
There are some main factors affected to value export of some Vietnam agricultural products including exchange rate, the distance between export and import countries, GDP of both countries, the population of both countries and agricultural land (Binh, 2011; Ngo, 2016).
According to economic theory, there are two basic types of demand, they are individual's demand and market demand. In this case study, the object is the demand of the domestic market for fruit exported by Vietnam. Therefore, both these types of demand will be considered with two main determinants of demand are price, own price and competitive price for the same product from another countries and income of the consumers.
Besides, during the period from 2011-2015, China is defined as one of the most important markets for agricultural export products from Vietnam with about 35 percent total value export of these products of Vietnam to the world (UNCTADSTAT, 2017). That is the reason to have to consider about effect from China to Vietnamese fruit export.
Therefore, this study set up the regression model as following equation (4):
where:
(EXVNQP)it : Quantity fruits exports from Vietnam (i) to import country (j) per capita, EXVNQP= ; Kg/person/year.
(DIST)ij : Distance between Vietnam (i) and import country (j); Km;
(EXRATIO)t : Local currency in USD/ Vietnam currency in USD in a year (t); USD/person;
(GDPC)jt : Gross Domestic Product per capita; 1,000UDS
(IMOTHER)jt : Total value import fruit of country (j) from the world, excluding Vietnam at year (t); 1,000USD;
(EXPRICEOTHER)jt : Export fruit’s price of country (j) at year (t) from another country, excluding Vietnam; USD/kg;
(EXPRICEVN)jt : Export fruit’s price of country (j) from Vietnam (i) at year (t); USD/Kg;
(AREAP): Agricultural area land per capita of import country (j) at year (t) (ha/person), AREAP= ; Ha/person;
DUMMY: DUMMY=1 if import country is China, otherwise DUMMT=0.
Base on the result from estimation, further regressions can be applied to getting better results of the study.
The study conducted three tests including cross-sectional dependence, serial correlation and heteroskedasticity. We found that there are serial correlation and heteroskedasticity problems. In order to remedy these problems, we applied Panel EGLS-1 and Panel EGLS- 2 (Table 3) (Gujarati, 2014; Wooldridge, 2015).
Table 3.
Estimation results via the least squares regression
Base on the results of testing and estimation, the <Table 3> shows that the Panel EGLS-2 is the fittest model for this case study.
In the Panel EGLS-2 model, the estimation illustrates that there are two-factor groups which have opposite way affect to quantity fruits export of Vietnam to our top trading partners. The first group including three factors, they are EXPRICEOTHER, GDPC and DUMMY which have a positive effect to quantity export of Vietnamese fruit. Another group including the rest of five variables, they are EXPRICEVN, DIST, EXRATIO, AREAP and IMOTHER which have a negative effect to quantity export of Vietnamese fruit.
The average relationship between dependent variable and independent variables can be found by applying a general regression method to establish the relationship between export factors and fruit exports in Vietnam. However, the effect of these export factors on fruit export in Vietnam can be different in different export scale. Therefore, general regression methods that represent the average correlation have limitations in terms of utilization of research results and improvement of effectiveness (Koenker, 2005). As a result, it is desirable to use the quantile regression method to estimate the effect of various export determinants on fruit exports in Vietnam in more detail by the number of export scale (Table 4). Quantile regression is a type of regression analysis used in statistics and econometrics. Whereas the method of least squares estimates the conditional mean of the response variable across values of the independent variables, quantile regression estimates the conditional median of the dependent variable. In addition, the quantile regression method also can solve the problem of heteroskedasticity (Koenker and Bassett, 1978; Lingxin and Daniel, 2007).
Table 4.
Least squares and quantile regression result comparison
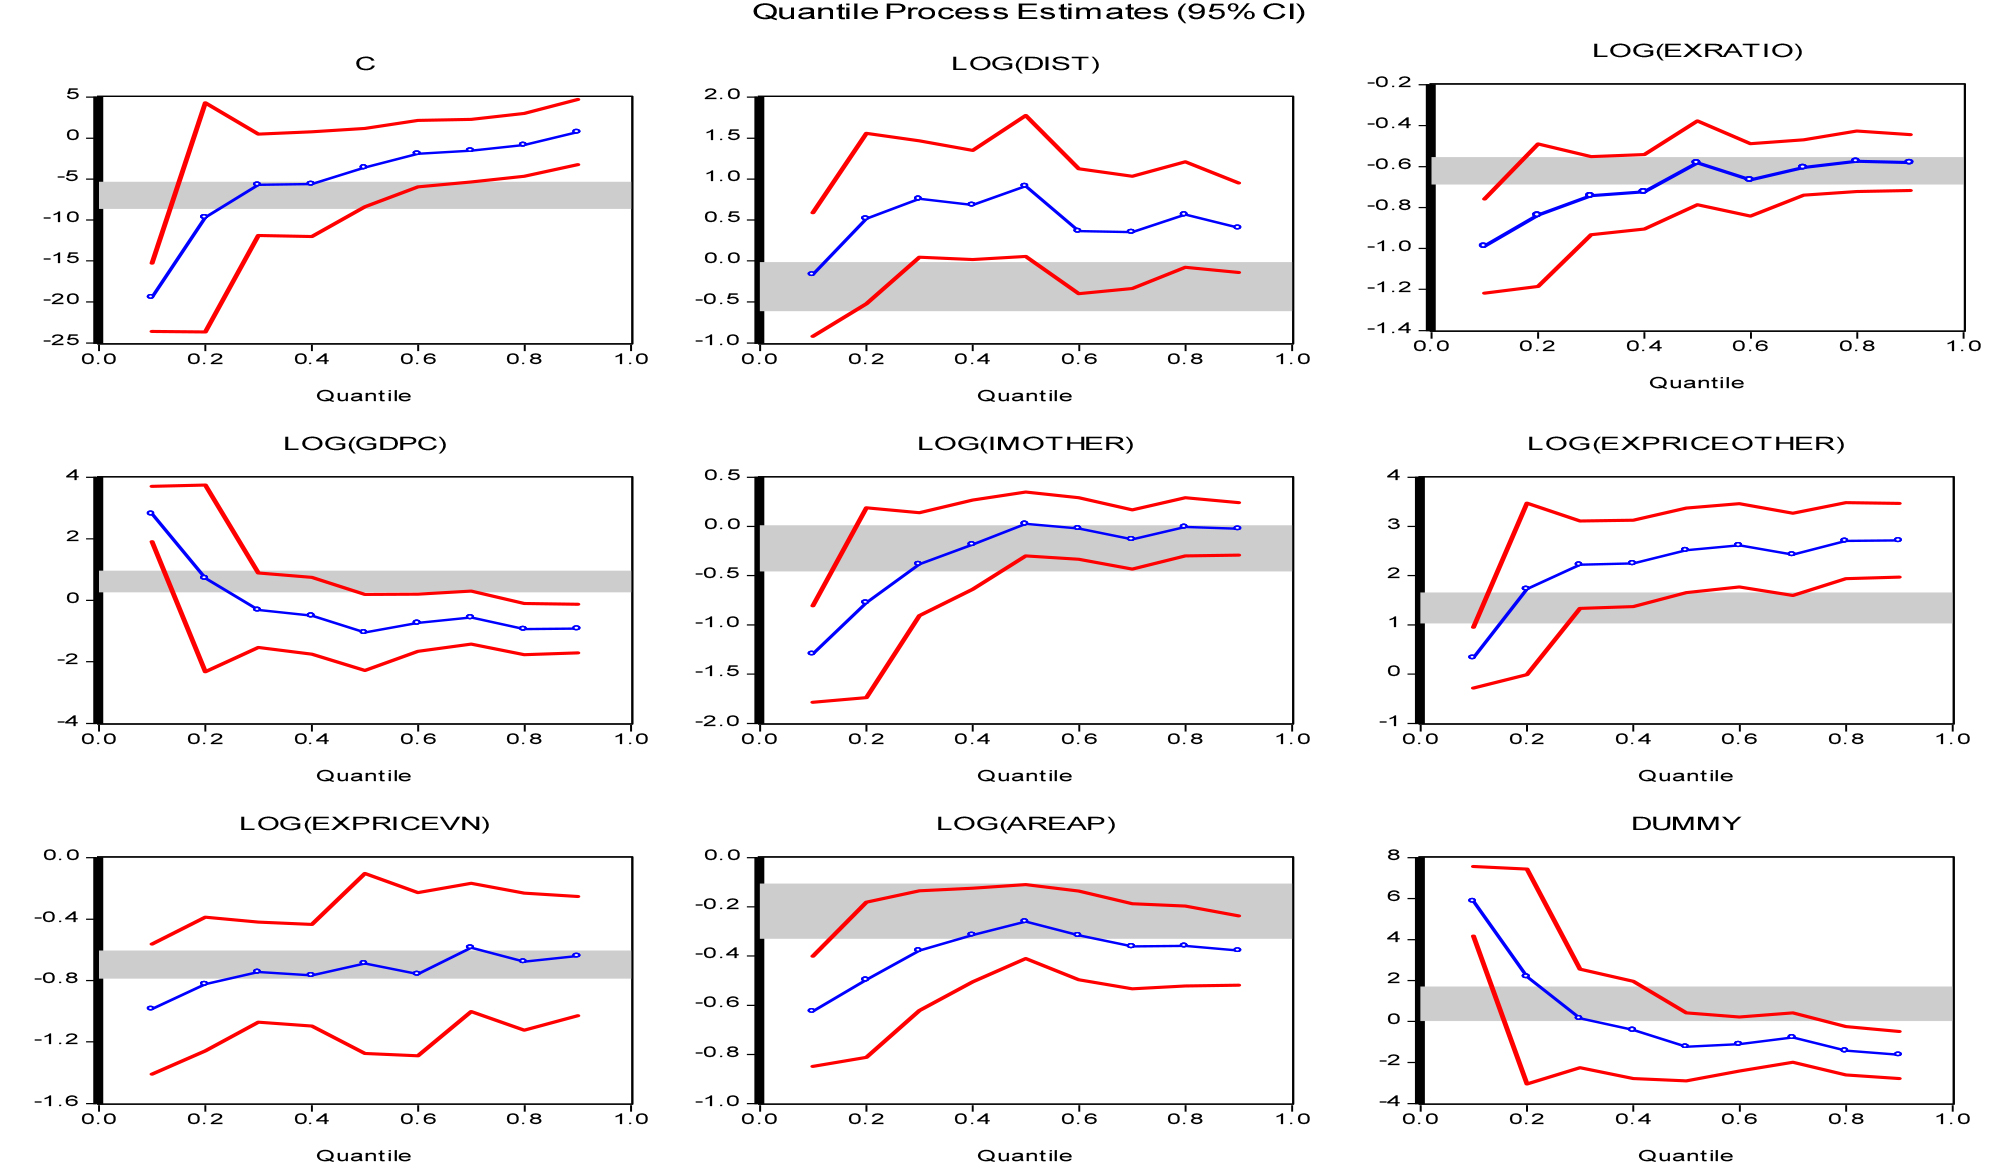
Fig. 2. compares the difference five-quantiles regression of Vietnamese fruit export quantity from GLS regression. In GLS, the coefficients are fixed while they are moving following increasing of quantile in QR.
PRICES (EXPRICEVN and EXPRICEOTHER)
The result from GLS estimation shows that the changing in price export from competitors has strong effects to the export quantity of Vietnamese fruits which is a consequence of lacking loyal customers whom Vietnamese fruits exporters have not got until now; while the result from QR indicates that there is a positive relationship between export scale and EXPRICEOTHER which has the coefficients increasing from 0.333 to 2.718 following the increasing of quantile.
In fact, Vietnamese fruits export’s price to Vietnam's top trading partners is usually higher than their competitors in the world (ITC, 2017) because of higher quality compared with the same products exported from other export countries. This can be considered as the an advantage factor for the export market. However, the main reason for high price is high transportation costs, low productivity and undeveloped technologies (Vietnam Fruit & Vegetables Association, 2018).
GDPC
In GLS regression, GDPC or individually income of consumer is one of the positive factors affected to Vietnamese fruits export quantity. The coefficient of this variable is 0.62, it means that the fruits exported from Vietnam are elasticity with consumer’s income. As the result, in the import countries where people have higher income can have more demand to consume Vietnamese export fruit. However, seeing the detail on each quantile in QR we can realize the inverse relationship between GDPC and quantity of Vietnamese fruit exports. From quantile 0.4, the negative effect between two those variables is started and increasing following the increase of quantile.
Base on the estimation of export factor GDPC by quantile regression, Vietnam’s fruit is treated as inferior goods if the export volume is very large such as quantile 0.8 and 0.9. However, least square’s GDPC coefficient is 0.617 which is treated as normal goods.
DUMMY
The positive effect from DUMMY variable in GLS regression shows that China has an important role in the Global market of fruit exported by Vietnam. With China participation, the export quantity per capita of Vietnam can be increased by 0.88 percent. However, QR shows the inverse relationship from China to quantity fruits export of Vietnam. Those coefficients are increasing the negative effect and highly significant in quantile 0.8 and 0.9.
From 2015, the value fruit exported from Vietnam to China was decreased while the quantity was increasing (ITC, 2017). The reason is the price of fruit export from Vietnam was decreased due to the more strictly requirement from China for the quality of fruit export, particularly the sanitary and phytosanitary standards (SPS), and traceability.
DIST
In Gravity model, the distance was considered as the one of certain negative impact to trading between two countries and it is proved one more time from the result of GLS estimation. One percent increase in distance between two countries leads to 0.31 percent decreasing in Vietnamese fruits consumption by each consumer in import countries. Going to detail each quantile in QR we can realize one important point is that the coefficients of distance variable was an inverse sign from the quantile 0.1 to quantile 02 and increasing lightly positive effect in higher quantile. It leads to the truth that some of Vietnamese fruit trading partners whose have long distance with Vietnam such as Australia, Netherlands, and America have the high demand for tropical fruits from Vietnam.
EXRATIO
The GLS estimation result shows that one percent increase in the exchange rate ratio between the import country and Vietnamese leads to 0.62 percent decreasing in quantity of fruit import from Vietnam per capita. The results from the QR are quite similar with GLS regression except in quantile 0.1. As the explanations above, in the low quantile, Vietnamese fruits export is considered as normal goods. That is the reason explains for a strong and highly significant effect from exchange rate to quantity fruit export of Vietnam.
Choosing the import countries which have strong local currency power (small and stable exchange rate with USD) or the currencies which have smaller growing exchange rate growth rate in USD compare with the rate of Vietnam dong and USD) to increased export quantity of Vietnamese fruits can be regarded as the best solution for enhancing export fruit from Vietnam.
AREAP
The agricultural areas of import countries have negative effects on Vietnamese fruits export quantity. The country which has a small agricultural area per capita or this figure has decreasing trend can become a potential market for Vietnamese fruit export. In GLS regression, one percent decreasing in the agricultural area of import country leads to 0.22 percent increase in individual consumption of Vietnamese fruit exports in that country while in QR it changes from -0.633 to -0.38 in quantile 0.1 and 0.9 respectively.
The agricultural area per capita of most of the Vietnamese fruit’s top trading partner countries is very small, less than 0.4ha/person, except Australia and USA, have higher this figure but the trend is decreasing. This result can be used as one of the criteria for choosing potential trading partners of Vietnam when we want to expand fruit export markets.
IMOTHER
This variable considers about the Vietnamese fruits export’s competitors. In GLS regression, one percent increase in exporting from those competitors will lead to 0.22 percent decreasing of Vietnamese fruits export per capita while this number is about six times higher (-1.3) in QR in the quantile 0.1. It shows the relationship unstable between Vietnam and our trading partners who is in very low quantile. One typical example of this issue is the competition between Vietnam and Thailand to export fruits to China due to several similar types of tropical fruits is producing by both two countries and both countries are allocated in South East Asia.
Conclusion and implication
Once again, this study confirmed that Vietnam has a comparative advantage in exporting fruits in the world market with RCA index is over than 1. Specifically, coconuts, Brazil nuts and cashew nuts can be considered as one of the unique advantage product of Vietnam in exporting with RCA index is 19.69, highest in the world. As a result, exporting fruits is one of the target strategies for the export activity of Vietnam with forceful potential capabilities.
The result from export equation (GLS regression) shows that there are two group factors which have opposite way affect to quantity export fruit of Vietnam to our top trading partners (i) Positive effects group including three factors, they are fruit's export price of other exporters (except Vietnam), China participation and GDP per capita of import countries; (ii) Negative effects group including five factors, they are distance between import country and Vietnam, exchange rate ratio between import country and Vietnam's currencies, value of fruits imported from another countries, fruit's export price of Vietnam and agricultural area per capita. Apply quantile regression we can see more clearly the effects from independent variables to dependent variable and how it is changing by quantile which means that trading of Vietnamese fruits depends on the export scale.
Those all above criteria (independent variables) can be used as a reference for choosing the potential markets and loyal customers for Vietnamese fruits export. Base on the detailed impacts of each factor we also can define that Vietnamese fruits have advantages in quality to making the trade with high-quality markets such as Australia, USA. Simultaneously, we also need to consider about “far” markets where compare with Vietnam have opposite natural conditions (weather, soil…). Those markets can have a high demand for tropical fruits which is their favorite but cannot produce. Besides that, the shortest distance with the biggest market (size of population) like China is an opportunity for Vietnam develops our own export fruits industry. However, based on the unstable condition of this market, we should to reduce the proportion export to China, try to keep it in the stable volume and simultaneously finding other potential export markets to reducing risks. From the result of the analysis, we realized that we have plenty of advantages to developing Vietnamese fruits sector and the main constraints for Vietnamese export fruits are internal factors which come from production, marketing activities practical and knowledge about the International trade. As a solution, increasing the quality of Vietnamese fruits to adapt to higher requirements of China and enhancing competitiveness with others export countries is the best way to get sustainable development for Vietnamese fruits sector. It means that we can improve these weaknesses by changing ourselves to adapting with higher and higher requirements from trading partner countries or it will be freeze obstacles for exporting Vietnamese fruit in the future if Vietnamese do not spend our efforts to solve these problems.
In summary, making use of the advantages and trying to overcome the obstacles by ourselves as the mentions above, a clear and efficient strategy is a necessary condition for the development of Vietnamese fruits export. In the global context, do trading with which country always is difficult question base on both economics and political views. Suggestion for Vietnamese fruits exports from the results of this study, those factors including strong and stable economics (strong local currency power and high GDP per capita) and small agricultural area per capital or agricultural area has decreasing trend are the most important criteria to finding the potential trading partners for fruits exports. A detailed marketing strategy also needed to define the target markets by classifying target customers by the scale.
With the constraints about data accessing and time to doing, this study has some weak points. However, it is can be used as a reference for Vietnamese policymakers and exporter in the fruit sector. In the future, a further research should be implemented with extend the number of observation and go to more detail in each type of fruit group to have a profound and inclusive viewpoint about the potential and development of Vietnamese fruits export. As a result, a comprehensive strategy could be supplied.
